
Metric Hits 2006 Levels
The S&P/Case-Shiller Home Price Index, a core measure of U.S. real estate prices, reached its highest level in 10 years this past month.
Developed by famed financial economists Karl Case and Robert Shiller, the metric is supposed to measure repeat sales of the same homes in order to gauge true movements in prices. It comes in several iterations, including the National Home Price Index and the 20-City Composite Index.
Advertisement

Right now those indices are reaching levels not seen since before the financial crisis. (Source: “US home prices rose 5.3% in August: S&P/Case-Shiller,” CNBC, October 25, 2016.)
“All 20 cities saw prices higher than a year earlier with 10 enjoying larger annual gains than last month,” David M. Blitzer, managing director and chairman of the Index Committee at S&P Dow Jones Indices, said in a press release.
Looking ahead, “With the national home price index almost surpassing the peak set 10 years ago, one question is how the housing recovery compares with the stock market recovery,” he said. [Emphasis added.]
To answer Blitzer’s question, the stock market recovery is a mirror image of housing. Both the S&P 500 and NASDAQ are trading near all-time highs, as is the Dow Jones Industrial Average.
Regardless of short-term blips in equity valuations, the overall trend for stocks and real estate prices was positive once the post-crisis dust settled. There were regional differences in home price growth, to be sure, but both indices show that valuations are comparable to 2006.
This has many analysts spooked that another bubble has been formed to replace the previous one, an assertion made eerie by the Case-Shiller charts.
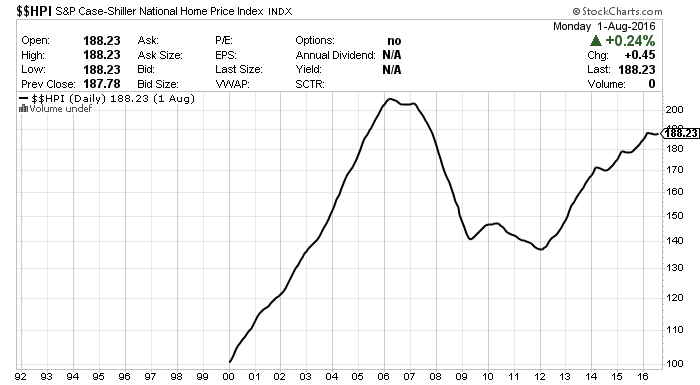
Chart courtesy of StockCharts.com
As we know all too well, subprime mortgage lending drove huge increases in real estate prices from 2000 to 2007. The “house of cards” economy formed during that time began to crumble as mortgage delinquency rates began to skyrocket, ultimately leading to the most disastrous financial crash since the Great Depression.
That story was chronicled by the Case-Shiller Index. Now that it is returning to those dangerous levels, analysts are pausing to consider whether or not we are on the brink of a second crisis.